Paint production is done by the numbers at Pittsburgh, PA-based PPG Architectural Finishes, a division of PPG Industries and maker of popular national paint brands such as Pittsburgh Paints, Olympic Stains and Lucite Paints. Information on actual output, time, and run speeds is collected automatically from packaging line sensors via programmable logic controllers. That data is analyzed by Performance Index (PI) software from Zarpac (Oakville, Ontario, Canada), specifically designed for packaging analysis.
With its number-crunching algorithms and easily understandable graphics interface, PI paints a precise, comprehensive picture of performance from the depalletizer to the palletizer on several lines at PPG’s Dover, DE, plant. “It offers an exact, unforgiving view of what’s happening,” says Bruno Pierannunzio, manager of packaging engineering. “It can provide a time-based graph of second-by-second events. It’s invaluable—you see patterns you otherwise cannot capture or see.”
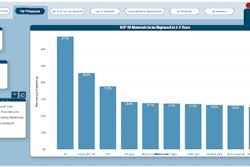
The PI software makes the mountain of data collected as useful as it is accurate. “It converts the raw data into pie charts, bar graphs and reports in such a way that managers, supervisors, maintenance personnel and plant floor people can make solid decisions,” explains Pierannunzio.
“The idea is to measure all the faults we possibly can, always looking to reduce downtime,” he continues. “With what we learn, we can make improvements.”
Improvements indeed. Pierannunzio reports that through mid-year, the plant was 12% ahead of the forecast plan this year for gallons/man hour, which is how PPG measures its productivity. He credits the software as a main reason for that improvement.
Objective and consistent
PPG was the beta site for PI Version 4.1, which allows data collection without operator intervention, The automated aspect was crucial for PPG, says Pierannunzio: “The objectivity and consistency are what attracted us the most.”
Before, PPG tried different ways of recording events during the packaging process. All of them involved some form of manual logging of information by packaging line operators. These failed due to data being inaccurate and inconsistent. Thus, no one trusted the information, says Pierannunzio: “What made this even worse was that line operators were doing nonvalue-added tasks in recording the data.”
In July ’99, PPG concluded the software was a winner after they’d completed the beta site test, Pierannunzio says, and have been getting accurate data since then (see sidebar).
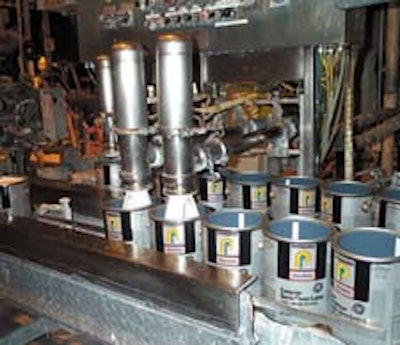
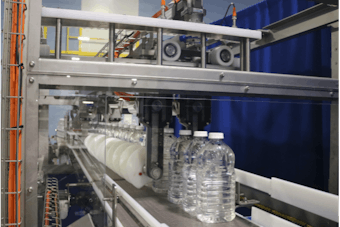
Packaging World visited PPG’s Dover plant to view the system in operation on a 1-gal line, one of several packaging lines analyzed by the PI software.
Data is collected on all operations from depalletizing through palletizing. In between, the cans are labeled, filled, lidded, baled (application of metal handle), ink-jet coded and loaded four gallons per case before a bar code is ink-jet printed on the case and the bar code is analyzed. The cases then convey for palletizing and off-line stretchwrapping.
PPG monitors data in a 24-hour cycle from 4 a.m., a timeframe that overlaps the plant’s two shifts that run from 6 a.m. to 10:30p.m. This “smooths” out shift-to-shift imbalances. During those 24-hour cycles, PPG has set the PI to sample the data continuously via sensors throughout the line.
The sensors are a combination of existing ones dedicated to machine control and supplementary ones needed to provide proper data collection. On the 1-gal line, PPG uses five different sensing points on each machine to supply information to the PI software. Many of the sensors used were existing as provided by the machine supplier or from the line integration and control on key transfer or conveyor points, says Pierannunzio. These devices include photo sensors, proximity sensors and limit switches from Effector (Exxon, PA), Rockwell Automation (Milwaukee, WI) and Micro Switch (Freeport, IL). For example, on the filler, sensors on the infeed and discharge sides provide status and container count information. “We can track any downtime occurrences and duration for every machine on the line,” he says.
For programmable logic controllers, PPG has standardized on Allen-Bradley PLCs from Rockwell Automation. Pierannunzio says they were able to reprogram existing PLCs to accept the right data from the sensors.
The ‘heartbeat’ sensor
There is one sensor location at the caser discharge that Pierannunzio calls the “heartbeat of the line.” Every case that passes by this sensor is time-stamped, which is recorded in a PLC and used by the PI program. It benchmarks the start and finish of changeovers, which PPG refers to as a changeout.
Plant personnel put a lot of thought into this, explains Pierannunzio. “From a combination of signals from the line sensors, we know when the last case for one product passes this point and when the first for the next item starts. This makes PI a deadly accurate method for measuring changeouts.”
The PI software operates on a PC running SCADA (Supervisory Control and Data Acquisition) software from Intellution (Norwood, MA), according to maintenance mechanic Fred Mosie, the key plant person in PPG’s adoption of PI. The SCADA PC, by running the Intellution and PI software, continuously consolidates the raw data collected by the PLCs over the packaging line and plant networks, which is a combination of Ethernet and Rockwell Automation’s Data Highway Plus.
“We can view history or have a live update of any of the packaging lines’ performances at any time,” says Pierannunzio. Information can be accessed from Pierannunzio’s or Mosie’s office PC right over the plant network, as well as from the operator’s PCs on the production line. Mosie explains that PI permits three levels of security: operator, management and administrative levels.
PI has a number of ways to look at the data (see sidebar). The software generates one key number, the Performance Index, that Pierannunzio refers to as an “unforgiving number.”
“With PI, you have the capability to account for every minute of the 24 hour day, not just as you’re running, either,” he emphasizes, referring to production halts of all types including lunch breaks, changeovers, scheduled, unscheduled and the like. “The software brings out all the skeletons in your production closet, but by the same token, the software also shows your strengths,” he adds. “It helps reveal opportunities to improve performance and provide the data to justify the investment for changing the process.”
Results
One of the revelations for PPG was that actual machine breakdowns, though notorious in reputation, are a very small part of total line “downtime.” The PI software can quickly generate a bar graph comparing each machine’s unscheduled downtime along with scheduled downtime as in change out and breaks. After trending this type of data, it became clear where PPG should focus its effort.
“Historically we’ve focused on machine breakdowns as a major source of downtime but the data clearly revealed that changeout and the run up and rundown time associated with changeout is a much bigger problem,” says Pierannunzio. PPG averages 12 changeovers a day on the line and, for instance, management knows with certainty a label change requires 4-5 minutes.
PPG’s goal was to reduce changeover time by 10%. “We ended up driving it down by 25 to 30 percent,” says Pierannunzio. “Changeover reductions have yielded substantial dollar savings. We can attack the real problem, not a perceived one. With PI, we have a clear hierarchy of problems to attack rather than wasting time on the ‘problem of the day.’ With quick feedback from the PI data, we can see very quickly if the process changes we make are effective and make corrections as needed.”
Cost investment small
For PPG, the upgrade to use PI was a “fairly small” investment in costs, but large in terms of time, Pierannunzio says. “A return on investment would be high compared to the capital costs. The improvement in changeovers alone that we’ve made would pay for the costs of this system.”
PPG’s current version is 4.1, but the company was moving into beta testing of version 5.0 on one line this past summer. PPG says one of the improvements it offers is to display all production lines simultaneously on-screen. It will also track a product by the manufacturing code and allows operators to enter information through point and click keying. Although this would seem to contradict the idea of automated data collection, PPG feels operator input for otherwise hard-to-track aspects will heighten management’s knowledge, especially regarding downtime. So they will be able to paint an even more complete picture of production.
See sidebar to this article: PI: Benchmarking a World Class line