As overall equipment effectiveness (OEE) insinuates itself in every sales opportunity, OEMs know that customers have a certain number in mind that represents their required OEE.
The problem for OEMs is determining how their customers define that number. One company might perceive another company’s accepted efficiency differently, as there are many ways to calculate—downtime related to changeovers, product in vs. product out, etc. There is also a variety of calculators out there for determining OEE.
From the OEM point of view, there is not yet an accepted industry standard for calculating OEE.
“I don’t think we can say from our experience there is an industry standard. Too many variables at play within each line,“ says Celie Reid, sales and marketing manager at Triple/S Dynamics, Inc., Dallas. “The problem [with standard calculators] for us, as a conveyor manufacturer, is all of the bits and pieces that make up the equation are totally out of our control.”
Defining OEE
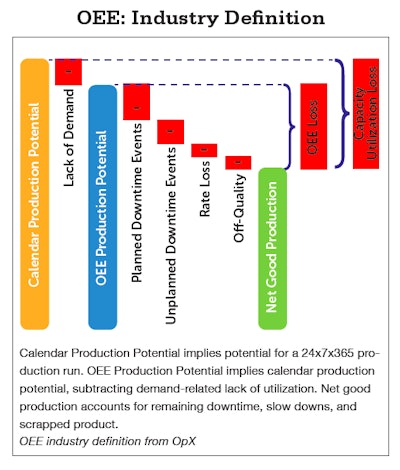
At a granular level, OEE can be calculated as the product of three percentages: availability, rate performance, and quality. All losses identified through the data collection process can and should be attributed to one of these three categories to systematically drive change at the appropriate level and magnitude.
• Availability describes the losses that result from downtime, both planned and unplanned. Some of the most common types of availability losses result from maintenance and cleaning activities, line changeovers, equipment failures, starvation due to missing input materials upstream, and blockages due to outages in downstream conversion work centers or handling processes.
• Rate performance describes the losses that result from running the equipment at speeds below the target rate. Rate losses inherently occur during ramp-down and ramp-up around machine stops, or from machine settings that differ from the target rate. The target rate is generally defined as the best demonstrated instantaneous rate that a SKU can run through the chokepoint of the production system. A machine may run different SKUs at different rates, but there should be only one target rate for each SKU for that machine.
• Quality describes the losses that result from quality defects. These losses must take into account all scrap and rework incurred over the identified interval for the given process. Sanitation defects, out-of-spec production, in-process damage, and incorrect material usage are some of the common examples of quality losses. For process systems that deliver continuous flows or bulk batches, the output may be graded based on certain parameters such as percent purity, percent solids, and density.
The OpX Leadership Network’s OEE Operational Reliability Solutions Group indicates 100 percent OEE is practically impossible. For example, even if all three factors were 95 percent, OEE would calculate to just fewer than 86 percent. The worldwide average OEE rate in manufacturing plants is around 60 percent, with 85 percent serving as the baseline from good to great.
Leo Robertson, COO, Pearson Packaging, Spokane, Wash., agrees that 85 percent is considered a world-class figure.
“The formula for that result would probably look like this: 90 percent availability x 95 percent performance x 99.9 percent quality= 85 percent world class OEE,” he says. Of course, actual expected performance and quality figures vary by model and application. “Based on the range of equipment [Pearson] manufactures, we can predict OEE figures to range from as low as 75 percent to as high as 89 percent. Availability is primarily under the control of the end user and is usually the most variable metric.”

Robertson believes that most of the customers Pearson works with understand what levels are achievable and what levels are pipe dreams. In the rare cases where customers require a higher than achievable le
vel of performance, Pearson will do everything it can to negotiate a workable compromise. If that doesn’t happen, Pearson will decline the project rather than risk disappointing a customer. Being aware of your limits as an OEM is important when it comes to OEE, according to Bob Williams, VP and general manager at Axon, Raleigh, N.C., a division of Pro Mach.
“An OEM must know their equipment, and accurately assess the probability of success given the unique characteristics of each application,” Williams says. “A customer who is not realistic is dangerous. No one can afford a bad install, and there are times when given the conditions, it is better for an OEM to walk away, then to ‘take’ an order, and then spend thousands of man-hours and dollars trying to meet an unrealistic performance guarantee.”
That being said, he feels there is usually some level of negotiation with OEE expectations, but timing is everything.
“When pursuing the order, there seems to be no wiggle room and CPG’s are looking for a number,” he says. “But, after the PO is placed, the expectations become somewhat relaxed when other factors come into play like plant conditions, operators, environment, materials, etc.”
Reid has experience dealing with customers seeking the impossible and responds with the caveat that what happens on the line before or after their machine is not included. She deem
s this as the critical part of the equation for fellow OEMs.
“Most performance guarantees that we have been handed each application,” Williams says. “A customer who is not realistic is dangerous. No one can afford a bad install, and there are times when given the conditions, it is better for an OEM to walk away, then to ‘take’ an order, and then spend thousands of man-hours and dollars trying to meet an unrealistic performance guarantee.”
That being said, he feels there is usually som
e level of negotiation with OEE expectations, but timing is everything.
“When pursuing the order, there seems to be no wiggle room and CPG’s are looking for a number,” he says. “But, after the PO is placed, the expectations become somewhat relaxed when other factors come into play like plant conditions, operators, environment, materials, etc.”
Reid has experience dealing with customers seeking the impossible and responds with the caveat that what happens on the line before or after their machine is not included. She deems this as the critical part of the equation for fellow OEMs.
“Most performance guarantees that we have been handed call out ‘no less than 99.99 percent mechanical reliability, running for 15 to 20 eight-hour shifts,” Reid says. “This statement is qualified by including the phrase ‘that an upstream or downstream event will not be included.’ Depending on where your equipment is in the line, you can negotiate with a CPG.”
It is at this point in the process that OEMs must push back against CPGs or avoid the project all together. Obviously it helps if you know your solution is the best or only one that will work for that particular application.
“It really helps if the OEM has experience with the product,” she says. “The main thing we do every time we receive an OEE requirement is to have several people read it very carefully. Then we try to negotiate out things that we can’t control, and keep our fingers crossed [that the CPG will be realistic].”
Several OEMs recommend reminding customers that a machine builder cannot guarantee what an end user’s employees will do once they receive the machine. The buyer’s under trained employees can be a big problem, so those expectations need to be negotiated as part of the terms and conditions prior to purchase. Otherwise, it creates the opportunity for disagreements further down the road. Some OEMs ask that their customers’ employees have completed a training program as a condition of warranty. The high rate of employee turnover creates opportunities for customers to change their expectations and not communicate it.
While Pearson will walk away from unrealistic expectations, Robertson thinks those situations should be the exception rather than the rule.
“Our intent is to find methods to support our customers in ways that meet their needs and support effective factory and plant acceptance testing, and to provide long-term satisfaction with their packaging systems,” he says. “The vast majority of the time, we can accomplish this by focusing on the factors that comprise OEE, where we can have the greatest effect. We are able to confidently commit to high performance and quality figures. We also regularly break out availability factors such as changeover time and machine break-down issues to be considered separately."